Highlight High and Low Points in an Excel Chart Dynamically

Creating a chart is an easy task. Effective communication however, is an art. This technique will help you create professional charts in Excel by showing you how you can dynamically highlight high and low points in an Excel chart, in a way that it responds to changes in the data – without doing it manually!

Steps to Highlight High and Low Points in an Excel Column Chart

To draw an interesting story out of your data, you need to know some tricks to either cleverly label data on a chart or highlight data points in a chart. There are many techniques that would help you to make professional looking charts in Excel.

In today’s article, we’ll see how to highlight the high and low data points in an Excel chart.

We’ll follow these steps:

  • Get your data in place

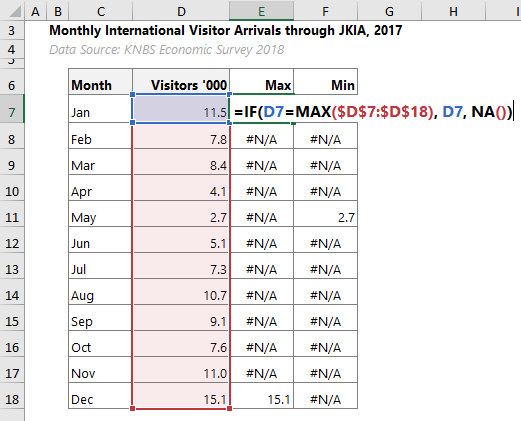
    To highlight the high and low points on the column chart, we need to generate two extra columns of data -one for highest value and the other for the lowest value.

    The formula used for the minimum column is equally the same with the one shown for the maximum column below. The only difference is that instead of MAX you’ll replace with MIN

    In normal circumstances, Excel charts do not display error values. We’re therefore introducing the errors here to be able to hide the series, apart from where we have a value corresponding to either the maximum or minimum.

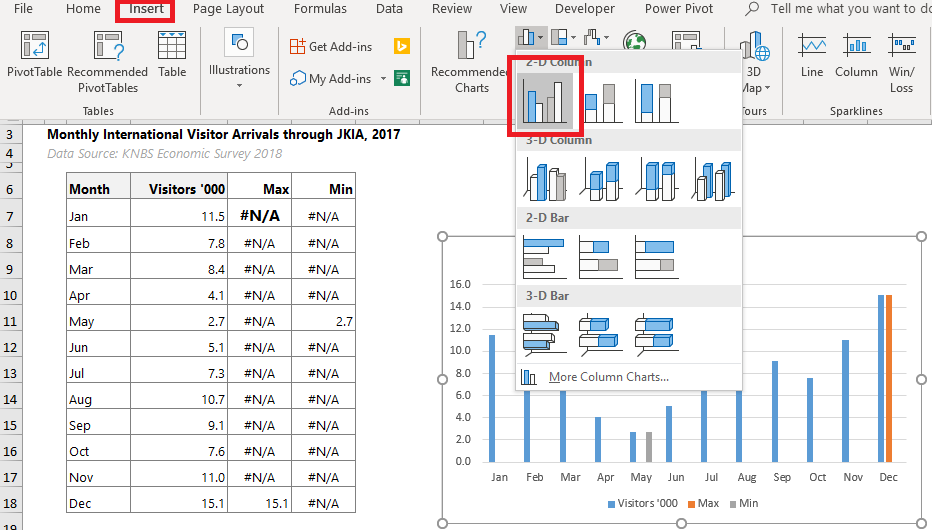
  • Insert a 2D clustered column chart

    Select the entire data set and from Insert menu, add a clustered 2D column chart

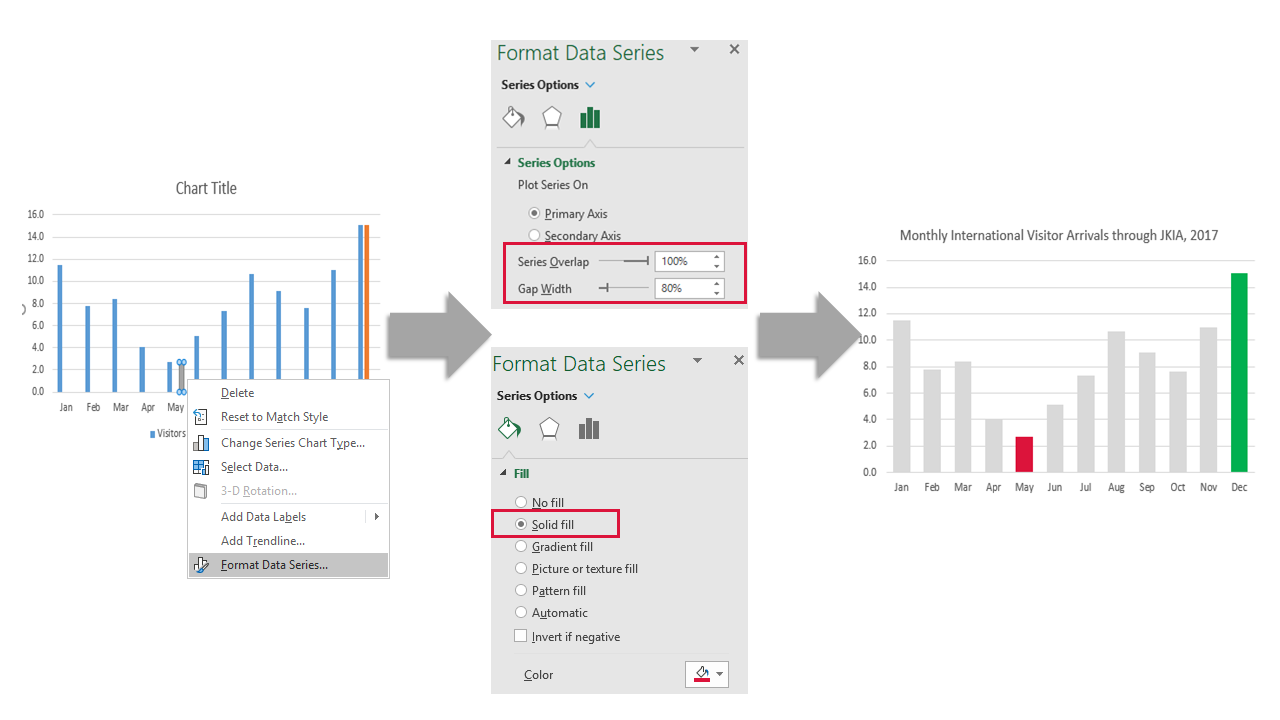
  • Format the series to overlap 100%

    Right click on one of the series, choose Format Data Series… On the formatting options, change the overlap to 100%, reduce gap width to say 80%, and change the colours accordingly

    Highlight High and Low Points in an Excel Chart

Steps to Highlight High and Low Points in an Excel Line Chart

  • Get your data ready

    This step is similar to what you did with the column chart above.

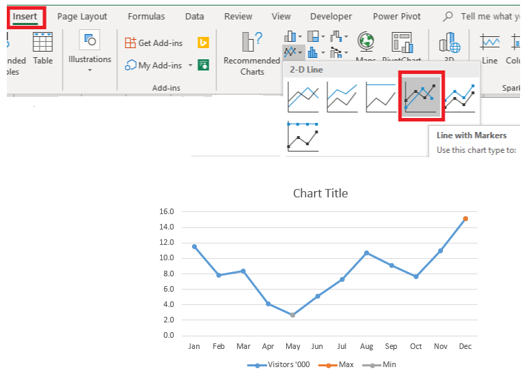
  • Insert a clustered line with markers chart

    Select the entire range of data and from the Insert menu, choose the first line chart with markers (called clustered)

  • Format the markers for the maximum series

    1. Select the specific series to format
    2. Right click and choose Format Data Series…
    3. Under Fill & Line formatting options, make the following changes
      • Choose No line for the line colour
      • For the Markers:
        • Border -choose Solid line >>>colour Green and increase the line weight / width to about 4 points
        • Fill -choose Solid fill >>>White colour
        • Marker Options -check Built-in and increase the size of the icon to 11 or so points
    4. Repeat steps 1 to 3 above for the minimum series

Please follow the video above for the complete formatting options for the line chart.

Sharing is Caring

If you found this useful, kindly click on the share buttons below and help me reach more people.


Have a great charting time!

Do you have a question on this or another charting techniques, let’s chat in the comments below

grab user attention

with magazine-style charts and visually-rich tables

Discussion

Leave A Comment