Wondering how to convert PDF to Excel format for further analysis? This could be financials for a given company, your bank statements or statistics downloaded from your national bureau of statistics.
If you’re like me, you probably have tried to select a table within the PDF, copy and paste to Excel, but what happens?
You end up with all the data in one cell as opposed to different columns of data 😒.
The next stop to extract the PDF data to Excel would be to leverage the many online tools that do that. You however are concerned about the sensitivity of the data. And even if you’re not, these online PDF converters usually return the data as multiple worksheets and you still need, in some cases, have to combine into a single table.
This article will show you how to not only import the PDF, but also leverage Power Query in Excel to clean, reorganize, and if need be, combine the data into a single table.
A look at the PDF data
In today’s exercise, we’ll look at the 2019 Census data for Kenya. The table we’ll be extracting is a breakdown of the population by age and sex.

At the end, we hope to end up with 3 columns if data as shown here.
We shall get rid off of the age grouping within the Age field, and instead of having 3 columns giving the split by sex, we shall have sex in a single column and population count in the next column.

How to Convert PDF to Excel in Excel Power Query -the STEPS
📌💡 The steps illustrated in this article apply to users who have Microsoft/Office 365 version of Excel. At the point of writing this article (July 2022), all the other SKUs including the latest one, Excel 2021, do not have the capability. For a FREE alternative with exact same steps as discussed here, you can download MS Power BI and watch this video for a similar step by step guide.
If you prefer video to follow along this article, please check the accompanying video below.
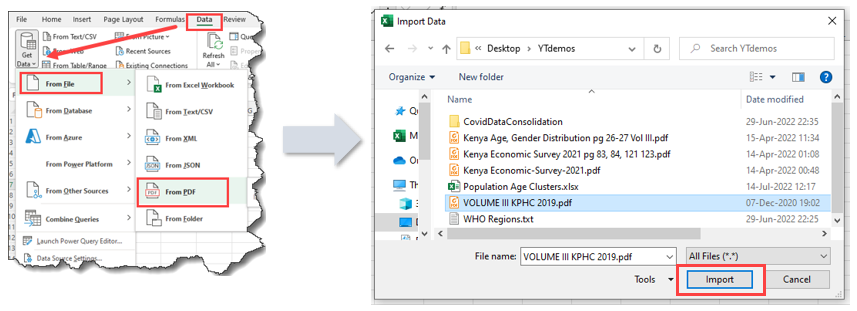
Step 1: Use the PDF Connector in Excel from the Data Menu
In Excel Microsoft 365, go to the Data tab >> click Get Data >> From File >> From PDF. This will prompt you to navigate to where your PDF is stored in your computer. Navigate and select the PDF file and press Import.
Step 2: Select the tables or files from the PDF file navigator
When you press import from the previous step, the following navigator will pop up. It usually will have a mix of tables and pages available from the PDF. The tables are denoted with the blue upper border.
📌💡 Please note the navigator below can take several minutes to load all the pages and tables. This will depend majorly on how heavy the PDF file is, the number of pages it contains, your computer capabilities, and probably the number of open applications in your machine.
In this step, you need to:
- Check the “Select multiple items” to allow you tick the specific pages or tables you want to connect to.
- Tick the specific pages -in this example we select tables 22 and 23 which are in page 26 and page 27 respectively. You’ll see a preview of the data in the selected object on the right side. Page 26 has data for ages 0 to 49 while page 27 has data for ages 51 and above.
- If the data is clean and no transformation is needed, click the Load button. Otherwise, click Transform Data to launch the Power Query Editor to reshape your data. In this example, we go with Transform Data.

Step 3: Data transforming in Power Query
The previous step will load the Power Query Editor shown below.

Both tables are laid out in a similar structure, so the data cleaning will be the same steps.
The GIF below illustrates the steps that need to be carried which include:

- Rename Table023 (Page 27) to pg27 and Table022 (Page 26) to pg26.
- Promote first row to be the column headers. Go to Transform tab –>click the Use First Row as Headers option.
- Delete the total column. You can select the column and press delete on the keyboard. Alternatively, right click and choose to Remove.
- Filter out the total and subtotal rows in the data. Here you can click the filter handle from the Age column and either:
- Untick the row values that you want to eliminate, or
- Choose Text Filters –> Does not contain –>specify the hyphen
- Further, for page 27 (that is, pg27), filter out the “Not stated” row in the Age column
We end up with the two tables as shown here:

Step 4: Append the two tables in Power Query
In the previous step we ended up with 4 identical columns in each table –Age, Male, Female, Intersex. We can append the two tables by going to the Home tab >> Append Queries >> Append Queries as New as illustrated below.

If you have more than 2 tables, click the button as indicated in the image above. You’ll get the below dialog box and you can move the tables from the left to the right side. You can also define the order of the tables by moving up or down.

When you press okay, you should get an additional table that has the 2 tables combined. Rename this to KenyaPopAgeSex or any other appropriate name.
Step 5: Unpivot the sex column
Recall the end result we are after?
At this point, the population count in the appended table is still shown as 3 columns for each sex. We want to reorganize this.
What we need to do here is called Unpivot Columns.
I’ll show you my preferred approach but if you want to see other ways to do the same, please check out this video where I discuss more on Unpivot Columns in Power Query and how to use the Fill Down/Up feature.
This is what you need to do:
- Select / Highlight the 3 sex columns that we need to unpivot
- Right click on one of the headers of these selected columns
- Choose Unpivot Only Selected Columns from the pop-up menu that appears
- Rename the resultant columns accordingly. You can double click the column headers to rename OR from #3 above, go to the formula bar and update the “Attribute” to “Sex” and, “Value“ to “Population Count”

The result of unpivoting is as shown below.

Step 6: Final Clean Up
In this step, we’ll do two steps:
- Filter out the hyphens from the population count column >> click on the filter handle/button on this column as we have done previously.
- Apply the correct data types to each of the fields. Press CTRL + A to select all the fields >> go to Transform tab >> click Detect Data Type.

Step 7: Load the Clean Data to Excel
You have successfully been able to import PDF data to Excel and shape it to your needs.
Next, go to the Home tab >> Close & Load >> choose Close & Load To…
📌💡Why Close & Load To…?
The first option of Close & Load will automatically load all the 3 tables as separate worksheets. Now, we don’t need all the 3 -we just want the combined table. As such, we use the Close & Load To… because it prompts us to specify how and where we want to load the data as shown below. We therefore will be selecting the Only Create Connection option initially. Then in step 3 below, we can define to Load To… for the specific table we want to analyze in Excel.

BONUS STEP
In step 2 above we selected multiple tables to be loaded.
You can, however, define a range of pages and then target the tables within those pages (as long as they have a same structure and similar data).
How, you ask…
Now, if you go to the source step of one of the tables we loaded above, you’ll see the following in the formula bar…

We can update the formula from…
= Pdf.Tables(File.Contents(“C:\Users\USER\Desktop\YTdemos\VOLUME III KPHC 2019.pdf”), [Implementation=”1.3″])
to this one…
= Pdf.Tables(File.Contents(“C:\Users\USER\Desktop\YTdemos\VOLUME III KPHC 2019.pdf”), [Implementation=”1.3″ , StartPage=26, EndPage=27])

What you’ll notice is that now you get a list of both pages and tables but covering all the pages in the range specified.
With this, you can go to the Kind column and filter to retain only the tables.
Next, right click the Data Column and chose to Remove other columns. The other columns are just informational and you can discard them if they’re not needed.
The data itself is available from the Data column in the figure above. To access the data, you’ll then need to click the two-sided arrows on next to the column header. This will open up the tables and display the data as shown below for you to clean up.

Most of the steps you’ll need we have already covered above. Go ahead and attempt it and let me know how you fair in the comments below. A key step in this case would be to filter out the header row repeated in row 63 in the image above. BUT, do that only after you’ve promoted row 1 to be column headers.
In Conclusion…
There is no scripted way of cleaning data in Power Query. It is an open canvas.
Whether you’re extracting PDF data using MS Power BI or using MS Excel as illustrated above, the steps are exactly the same.
In fact, if you started with Excel and import that Excel file to Power BI, the same will come with all the data cleansing steps. You don’t have to repeat! If this article helped you, kindly share on your social circles or email a friend.

Discussion
4 Comments
Leave A Comment
Related
If you found some value from this, please explore our other articles below!

![Ignite your Excel skills for speed and productivity [How to work faster in Excel]](https://datacycleanalytics.com/wp-content/uploads/2019/07/Excel-Speed-Boosters.png)


Dear some problem to convert PDF to Excel
Data
file form
from PDF not found how enable this
Please confirm what version of Excel you’re using. This is available for Excel 2021 or Office 365.
“This was super helpful! I had a scanned PDF that I needed to edit for a project, and the step-by-step guide made it really easy to follow. Convertez’s tool worked perfectly — fast, accurate, and completely free. Definitely bookmarking this site for future use!”
Glad you found this useful!