One of the common headaches I have come across in the course of my career as a Trainer in Excel Dashboards is the question of how to combine data from multiple worksheets into one master worksheet, so that you can analyze smartly.
Many general users of Excel retire to the time consuming method of copy and pasting, which works, if you have few worksheets.
But
It doesn’t have to be that way!
Learn at least 3 ways at your disposal to combine multiple worksheets.
Consider the following scenarios that can necessitate combining various worksheets include:
- For a teacher, this would mean merging data for various streams of the same grade into one, to help in ranking.
- You have received budgets from various business units and you want to have a consolidated position.
- Vehicle sales data coming from different outlets needs to be consolidated into a single worksheet.
- You have extracted 5 P&Ls from your financial reporting system and your task is to generate a summarized income statement from these individual profit centers.
- The ministry of health would want to consolidate the number of patients served from various dispensaries from different counties.
Please note that the challenge at hand is not to perform a lookup of additional columns that are stored in different mapping tables. Rather, we would want to have an appended data set (that is, additional rows).
This is a 3 part series that will equip you with all that you need to combine data coming from multiple worksheets or external sources into a single worksheet. You can use the links below to jump to your preferred starting point.
- Using Excel Macros/VBA to Combine Worksheets
- 3 ways to consolidate data in Excel
- How to combine data using Power Query in Excel (the rest of this article discusses this method)
How to combine data from multiple worksheets using Power Query: Query Editor in Excel
Power Query is a powerful way to combine data from multiple sheets into a master list for further analysis. It enhances Business Intelligence for Excel by helping you extract, combine and shape data coming from a wide variety of sources.
With MS Excel 2010, Power Query is not inbuilt but comes as a free add-in that you download from the Microsoft website. For MS Excel 2013 Microsoft Office Professional Plus, the Power Query comes inbuilt but you need to enable it among the Add-ins.

Power Query in MS Excel 2016
Excel 2016 comes pre-installed with Power Query. With this version of Excel, it has been named as Get & Transform.

If you want a deep dive into some of the “power” hidden in Power Query, Jon Acampora from Excel Campus has written a comprehensive article here.
Combine Data Using Power Query
In the example at hand, we have sales data for a fictitious company that operates in two regions: Nairobi and Mombasa. As seen in figure 2 below, the data is stored in 2 worksheets for each region.

In a third worksheet, the Finance Manager of the company seeks to analyze the data but first, he has to combine the data sets.
The method discussed in this post uses the Get & Transform feature in MS Excel 2016. The steps (similar to Excel 2013/2010) are as follows…
There’re more approaches to using Power Query to do this similar task, but we’re keeping this to the basics.
Step #1: Format the data as an Excel Table
First, ensure the source worksheets are formatted as Excel tables -that is, click any cell inside the data, then press CTRL+T (or CTRL+L). Similarly, you can select a cell in the data, and from the Home tab, select Format as Table and choose your preferred style.

Having formatted the data as an Excel table, you will notice an extra contextual Design menu appears on the Excel Ribbon. From this menu, you can rename each of the tables to make it easy to work with.

We shall name the Mombasa and Nairobi tables as MombasaSales and NairobiSales respectively.
Step #2: Using Get & Transform
From the Data menu, in the Get & Transform group, click From Table. If you’re using Excel 2010/2013 and you’ve enabled Power Query, go to the Power Query menu on the ribbon and locate “From Table”

Step #3: Create Custom Column in Query Editor
Step 2 above will open up the Query Editor window. In this step we shall create a custom column that will be used to identify the dataset you have loaded. The custom column is added from the “Add Column” tab in the Query Editor.

If you need to do further manipulation on the data, you can take advantage of the rich features in the Query Editor.
For this example, adding the region column is all we needed to do.
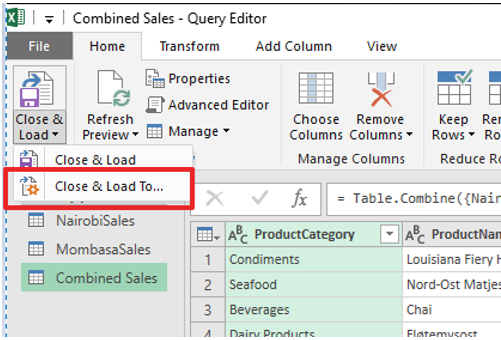
Step #4: Next, press Close & Load To…

The Close & Load To… option opens the Load To dialog box shown below. In this window, we will choose Only Create Connection. The “Table” option would load a duplicate table in your Excel worksheet. We do not want this!
Press Load to complete the process.

Step #5: Repeat steps 2, 3 & 4 for each individual worksheet
In this example, we shall repeat the steps above for the Mombasa sales data.
In step 3 though, the formula to create the custom column will be = “Mombasa”. The column heading need to be similar, i.e. Region.
As mentioned earlier, we’re using a basic approach. A better method would be to load all the tables in the workbook at once using the Excel.CurrentWorkbook() Power Query function. We shall look at this in another article as the steps will be totally different.
Step #6: Append the Queries
This is the step that helps us combine the individual worksheet datasets into a single worksheet.
Go to Data menu (or Power Query menu if working with earlier versions of Excel) and select New Query. In the short-cut menu, choose Combine Queries >> Append.

This opens the dialog box shown below. Choose the Three or more tables option.
Select each of the tables and press Add to move the table to the right side of the dialog box. Once through click OK.

When you press OK, Excel opens the Query Editor window to allow you make further adjustments.
Step #7: Rename Query and Close & Load To…
On the Query Editor, we shall rename the newly created table from the default “Append1” to an appropriate name. In this example we have called this “Combined Sales”.
Next, press Close & Load To… option from the Home tab on the ribbon.
The dialog box below will pop up.
This time round, we shall load the combined dataset into a new Table, and in a New Worksheet.

When you press Load, Excel will create a new worksheet with the original datasets combined.
You can now go on and do your analysis on based on this consolidated worksheet.
Step #8: Bonus Step
One of the advantages of using the Power Query approach to data consolidation is that you can access the Query Editor and make adjustments that you may have omitted as you did the first process.
For instance, you may realize in this example that the sales date column that was loaded into the combined worksheet comes with the time component which you may not need.
To avoid displaying the time component, select a cell in the combined worksheet.
On the Excel ribbon, you will see a contextual Query menu. Click Edit.

This will open the Query Editor window. On the Query Editor, ensure you have selected the Combined Sales query and the Sales Date column is selected.
Select Transform menu >> Date >> Date only.

Having done this, press Close & Load from the Home menu of the Query Editor window.
The sales date column is updated accordingly.
Further, when you make changes on the original worksheets and click Refresh from the Data menu, the changes are immediately reflected on the combined worksheet.
Final thoughts…
There is a revolution in the self-service Business Intelligence that is coming as a result of the Power BI Suite (Power Query, Power Pivot, Power View, Power BI Desktop, Power BI Web version) provided by Microsoft. I personally believe these features are a must know for all Excel Analysts as well as anyone interested in making smarter business decisions.
There are a lot of resources to learn these tools and it pays off. Mynda Treacy’s article is such a resource that will solidify your understanding of the Append feature.
[ctt template=”3″ link=”6qKHT” via=”no” ]The beauty of Power Query is that once set, you only need to refresh and not repeat the process! #DataCleansing #ExcelDashboards[/ctt]To me, the Power Query combined with VBA form powerful data shaping tools. I would choose Power Query any day!
Do it yourself
The best way to learn is to practice yourself, so download the workbook used to for this post to test your understanding.
Share this with your friends!

Discussion
Related
If you found some value from this, please explore our other articles below!
![Power BI DAX Measure [Crack the Challenge]](http://datacycleanalytics.com/wp-content/uploads/2019/05/DAX-Challenge-500x383.jpg)
![Using Excel Power Query to Unpivot Data [Extremely Easy That It Will Shock You]](http://datacycleanalytics.com/wp-content/uploads/2018/09/YouTube-Thumbnail-Using-PQ-to-Unpivot-Data-500x383.png)


