If you have used the MAX and MIN functions in Excel, then you know they return a single value representing the highest and the lowest value in a given range. LARGE and SMALL functions on the other hand allow you to specify whether you want the 2nd, 3rd, 4th, largest/smallest value in the same range. As such, you have to specify the range of values, as well as the ‘Kth’ element, where ‘K’ is any number 1, 2, 3, and so on. The ‘k’ element tells Excel what top/bottom values to return from the specified range.To illustrate this, we have a summary of sales amounts by SKUs where we have a total of 27 SKUs. A sample report is shown below. Click here to Download the file used.

The syntax for these two functions are:
=LARGE (Array, k) or =SMALL (Array, k)
In a given empty column in your analysis sheet, type the numbers 1, 2, up to 5. These numbers are our ‘k’ parameter in the formula. On an adjacent column, type the LARGE/SMALL function as shown below.

Notice that to get the bottom 5 list, you just change the function used in cell H6 above from LARGE to SMALL. Other parameters aren’t changed.
To get the SKU name associated with the sales amount in cell H6, we shall insert the following formula in cell G6. If you have a challenge understanding the INDEX and MATCH functions used below, be kind to leave a comment below.
=INDEX ($B$3:$B$29, MATCH($H6, $C$3:$C$29, 0))
The output of the above steps is as follows:

To create a dynamic list that would work interactively in an Excel Dashboard, we need to tweak the LARGE function used above, by nesting an IF function that uses a value that the user controls using an Option Button.
We start by inserting an option button from the Developer menu on the Excel ribbon. If the Developer menu/tab isn’t available for you, you need to enable it by right clicking anywhere on the ribbon, choose Customize the Ribbon…and tick the Developer menu on the dialog box that appears.
Inserting an Option Button to Swap between Top/Bottom Values
On the Developer tab, Controls group, choose Insert and select the Option Button icon as shown below.

Draw a reasonable size of the option button. Right click on the option button created and select Edit text. This will allow you to delete the default text that comes with the option button -once deleted, type TOP 5 SKUs. Next, copy this option button and once you paste, edit the text to read BOTTOM 5 SKUs as follows:

Next, right click any of the two option buttons and choose Format Control from the short-cut menu that pops up. The Format Control dialog box will appear.
On the Control tab, choose the link cell that will store the index/number generated once a selection is made on the button. In this example, we select cell $F$3.

When you click OK, cell $F$3 will not have a value until you make a selection on either of the option buttons. For Option Buttons, the number assigned for each is dependent on which one was inserted first. What we are interested with is this cell $F$3 to help us build a dynamic LARGE/SMALL formula.
For readability of formulas, we have named cell $F$3 as selOption from the Name Box. We adjust the formula in cell H6 as follows:
=IF (selOption=1, LARGE ($C$3:$C$29, $F6), SMALL($C$3:$C$29, $F6))
This will give you the flexibility to display top performing or bottom 5 performing SKUs interactively.
Most of the form controls (Option Buttons, Combo Boxes, Scroll Bars, etc.) generate a number representing the current selected item.
[ctt template=”3″ link=”dA8UX” via=”no” ]Option buttons in Excel normally return a number that helps you to do further analysis and create interactive dashboards.[/ctt]
The challenge with this methodology as seen in the results below, is the likeliness of having multiple SKUs with a similar amount. In that case, the INDEX formula that returns the name of the SKU will always return the same SKU name.
 Handling Duplicates While Using LARGE/SMALL
The LARGE/SMALL functions will return the repeated amounts correctly. The challenge, however, is that when you now use these amounts in the MATCH function that gives the row position for the INDEX function, the row number will be the same for all the repeated amounts thus making INDEX to return the same SKU name.
To address this, we shall add a negligible amount, say 0.01, to subsequent amounts. We thus have a helper column with the adjusted figures using this formula:
=(COUNTIFS(C$3:C3,C3)-1)*0.01 + C3

If the value appears on the list only once, there’s no reason to change the original value. If the amount appears more than once, I want to add 0.01 to it based on the number of times that it’s appeared on the list. In layman’s terms, the COUNTIFS function has been tweaked by locking the first C3. This ensures it counts up-to the current row where the formula has been auto-filled, hence returning a 1 for the first occurrence, a 2 in the second occurrence, and so on. As such, for the first occurrence of any given amount, we are adding a zero to C3, the original amount!
Find the completed Excel file here.
What other ways to show top bottom items in Excel?
Luckily, Excel offers various approaches to address this challenge. You can use PivotTables or a mix of RANK.EQ , IF function and Option Button form controls. You want to learn how? Download the 3 Ways to Show Top “X” Items in Excel Dashboards free eBook by signing up here:

Discussion
Related
If you found some value from this, please explore our other articles below!


![Ignite your Excel skills for speed and productivity [How to work faster in Excel]](http://datacycleanalytics.com/wp-content/uploads/2019/07/Excel-Speed-Boosters-500x383.png)
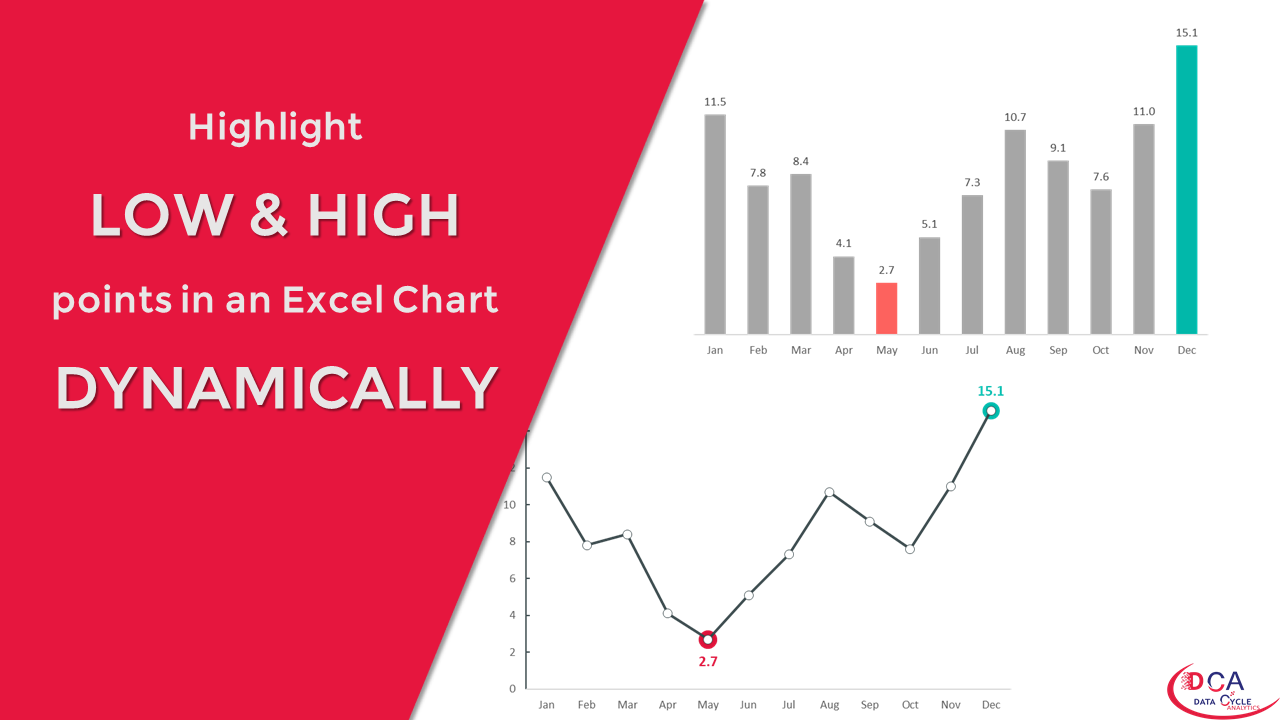
![Highlight High and Low Points in an Excel Chart [The Right Way]](http://datacycleanalytics.com/wp-content/uploads/2019/04/Highlight-High-and-Low-Points-in-an-Excel-Chart-500x383.png)

