The ability to visualize data insights in an easily consumable format is a skill that one needs to harness if they need to effectively communicate to decision makers in any given organization. Presenting rows of data in a spreadsheet can be very boring. Many data visualization features exist in spreadsheets (MS Excel) to help build visual displays of data but apparently not many have the skills to present in appealing dashboards.
This blog will avail to you various techniques that can add value to your presentation and charting skills.
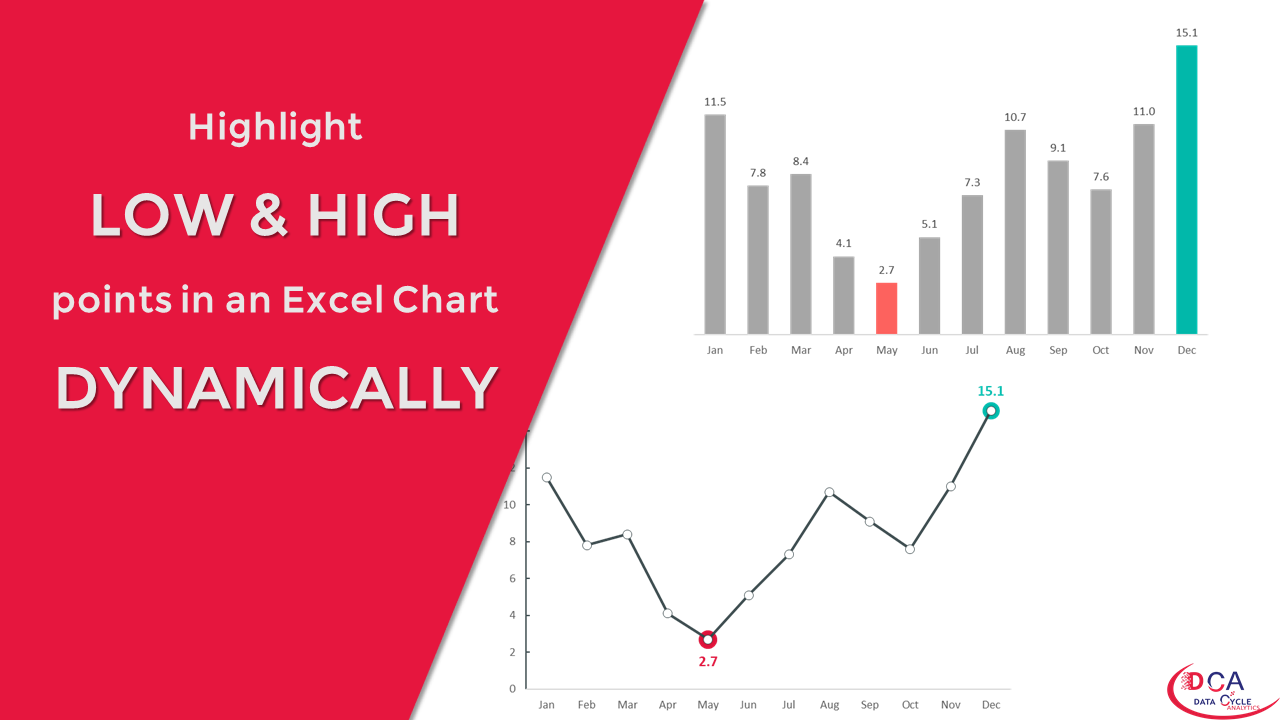
Highlight High and Low Points in an Excel Chart [The Right Way]
Highlight High and Low Points in an Excel Chart Dynamically Creating a chart is an easy task. [...]